At this time of year insurance companies, pension funds, provident and sabbatical funds are sending their annual statements for calendar 2017. The statements provide a summary of contributions made during the year, tax documents and data regarding fees and returns. The 2017 calendar year returns for the industry have been stellar with averages ranging from 6.9%-8.8% before fees, with some funds even reporting double- digit returns

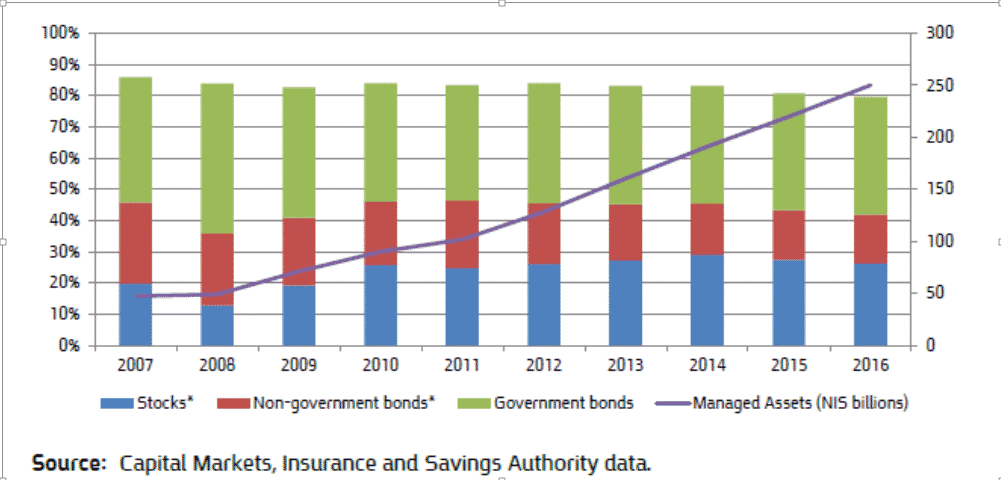
The strong returns can be attributed to strong bond performance, as well as equity markets underpinned by global economic growth. However, an interesting observation is that these returns were achieved despite a relatively low exposure to equities. Israeli institutions, in contrast to their global peers, in terms of portfolio asset allocation, are underweight equities. As can be seen from the diagram below, pension fund exposure to equities has hovered in the 20-30% range over the past decade. This is despite the huge influx of capital, with the industry more than doubling its assets during this period.
Israeli Pension Funds (New) Asset Allocation 2007-2016

Furthermore, this low level of equity exposure is even more surprising given the global bull market run from 2009, meaning that fund managers have not been drawn into the market to chase returns.
It is worth pointing out that the composition of the Israeli public portfolio historically has been conservative, perhaps in response to the perceived risk or volatility of the Middle East, or more likely due to the overall wealth. Amazingly, the Israel public portfolio totaled over $1 trillion at end of 2017 or $117k/capita. This strong balance sheet reflects the emerging wealth of Israel as a result of the economic boom and is also what has been attributed to supporting the shekel against other currencies.

This top-down figure includes the pension funds, cited above, but again shows that equity exposure is only 23% of the total. In a global context one could say that there is almost a risk aversion to equities and an ignoring of equity long-term performance and outperformance relative to bonds, based on historical data.
In contrast, in the US, equities have a higher weighting in both public and institutional portfolios. For example, corporate pension funds have an allocation to equities at 44% (WillisTowersWatson 2016), nearly double that of Israel.
Arguably, the equity culture is nowhere more pronounced than in the US, where both clients and managers agree and understand that equities are probably the best investment over the long term. This investment mantra is well supported by the long- term nominal return for the US equity market of 10.1% versus 5.4% for bonds (Vanguard).
As investment managers for clients who are often straddling both worlds, this difference in approaches is most marked when comparing a client’s portfolio of both US and Israel pension products. Indeed, we have seen many clients with US 401k or IRA products with 100% equity allocations, even some who are in their 80s and well into retirement. Furthermore, this often might be simply a few low-cost equity index funds. In contrast, the Israeli retirement product will typically have a much lower level of equity exposure, ~25%, and a more complex portfolio of private and public assets.
US/Israel differences aside, there is a more general question to be raised now, given current equity market valuations, bond yields and interest rate: What will be the expected returns for retirement products overall, and equity markets in particular, and how best to navigate? For the retirement investor the equity exposure is important, but is typically balanced by bonds and other assets and the time horizon is longer, so valuation or timing is less important, but is nonetheless a factor.
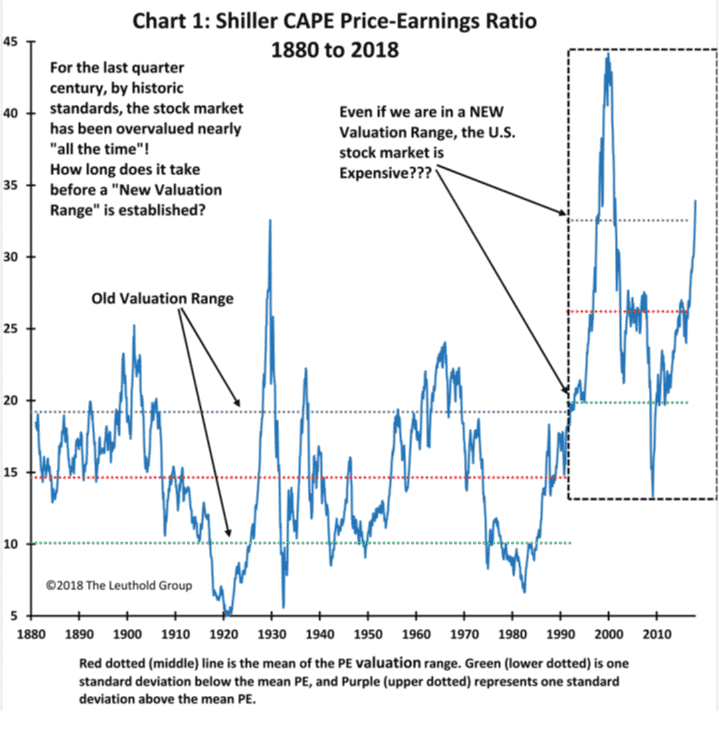
For the equity market, there is no shortage of graphs and articles indicating markets are closer to the higher end of historical valuation ranges. These levels of valuation are usually correspondent with modest long-term projections. Below is a long-termhistorical chart showing the popular Shiller CAPE Price-Earnings Ratio with different valuation ranges over time:

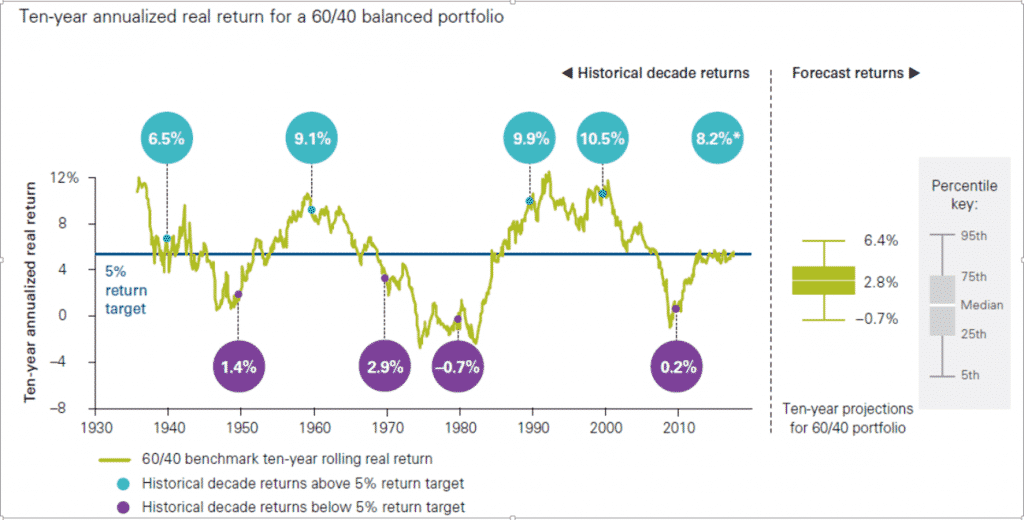
In general, retirement funds target a 5% annual real return over the long term. Investment giant Vanguard asked the question, “how often were retirement funds successful in meeting a 5% annual return over the long term?” They answered this question by analyzing the rolling 10-year real returns for a balanced portfolio of 60% equity/40% bonds historically. The graph below shows that nearly half the time the funds were unsuccessful in meeting this target. Interestingly, from the year 2000, this target was barely achieved; the last data point shows an 8.2% annual return for the customized period 2010-2017 period. Moreover, their analysis projects a median 2.8% annual return over the next 10 years, based on current valuation metrics for a 60/40 portfolio.

For the Israel retirement fund investor, the absolute and relative low exposure to equities might result in lower volatility of returns. Yet, implicitly, there appears to be a structural aversion to equities, which is not necessarily related to equity market valuation or performance. Due to the compression in bond yields over the past decade, this effect on overall performance may have been muted, as bond market returns gave back the “missing” equity market returns. Going forward, there is less room for capital appreciation based on bond yields and interest rate levels, such that the overall equity exposures will play a more crucial role in performance.
Therefore, the choice of retirement product and type of coverage is paramount. For a decision of this magnitude, professional advice by a licensed insurance agent is essential.
THE INFORMATION ON THIS SITE IS NOT INTENDED AS AND DOES NOT CONSTITUTE INVESTMENT, INSURANCE, LEGAL OR TAX ADVICE, NOR IS AN OFFER TO SELL ANY SECURITY, INVESTMENT PRODUCT, INSURANCE TO ANY PERSON OR A SOLICITATION OF ANY PERSON OF TO PURCHASE ANY SECURITY, INVESTMENT PRODUCT OR INSURANCE.
